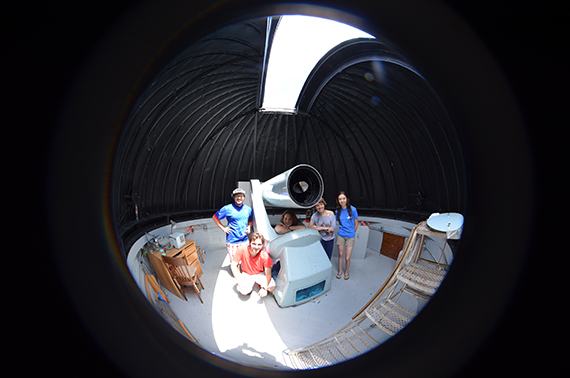
Students conducting summer research in 51·çÁ÷’s Foggy Bottom Observatory (L to R): Joshua Reding ’15, Zachary Weaver ’17, Luna Zagorac ’16, Anneliese Rilinger (Williams ’17), and Katie Karnes ’17. Photo by Matt Johnson ’15
51·çÁ÷ students are sharing their experiences conducting research with faculty members on campus and in the field. This post is by Katie Karnes ’17, an astrogeophysics major from Cincinnati, Ohio.
It’s 3:45 a.m. on a Thursday and I’m staring at the four monitors in front of me, trying to focus on saving the files correctly. Although sunrise is still hours away, the sky is beginning to lighten and this night of collecting data is coming to an end. This summer I am spending 10 weeks on campus working with in the physics and astronomy department.
At nighttime if the skies are clear, two of the five students in my research group will spend the evening at collecting data. During the day, we focus on our own projects.
Anneliese Rilinger (Williams ’17) and I are studying the optical variability of the quasar BL Lacertae. Luna Zagorac ’16 and Zachary Weaver ’17 are looking at the quasar 3C454.3, and Joshua Reding ’15 is studying supernovae light curves.
BL Lacertae, or BL Lac for short, is a type of quasar. Quasars are believed to be supermassive black holes in the centers of galaxies. They are also some of the most distant and brightest objects we have seen in the universe, which makes them useful for helping scientists learn about the early universe. As material from the galaxy falls into the black hole, energy is given off. Some of this energy is in the form of visible light that we can detect.
Quasars also exhibit variability, meaning that their brightness changes over time; however, no one understands exactly why they vary. By studying BL Lac this summer, we hope to find patterns in its variability on both a long-term scale, using data collected at Foggy Bottom over the past 20 years, and on a short-term scale, using data from a single night to see how it varies over just minutes and hours. Eventually, we may be able to learn more about the processes happening inside of quasars.
At the observatory, we take images of BL Lac using our 16-inch telescope and a specialized camera. To process these images, we first calibrate them to account for camera and electronic noise. Then, using some helpful programs that previous 51·çÁ÷ students have written, we extract data on the brightness of BL Lac from each image. Finally, we produce graphs called light curves that show how the brightness of BL Lac varies over time.
As a rising sophomore, this was my first research experience. It complements my astrogeophysics major and has made me even more eager to take other courses that are part of my major — which is a good sign that I made the right choice!
Follow us on Twitter .
